Power BI
Power BI ref guide: https://docs.microsoft.com/en-us/power-bi/desktop-what-is-desktop

DAX expression's with IF condition:
https://tejasadventure.blogspot.com/2019/10/power-bi-if-condition.html
DAX expression's with RELATED function:
https://tejasadventure.blogspot.com/2019/10/in-power-bi-what-is-related-function.html
Split Column:
2018-03-30T22:45:00+0000
From top ribbon, click on Split Column and select By Delimiter
For example split "T"
Power BI will split 2018-03 -30 as Date field of its data type and automatically changes in to date format as 30-Aug-2018 and remaining as Time field with "time" or "any" data type format.
Connect "facebook" with Power BI
We can connect via Online Service and connect facebook.
Using Query Editor shape the data eg: use fields like Posts, created date, Number of Comments etc and plot the charts.
The below example show the list of facebook posts and bar chart with number of comments received across each post

Introduction
Power BI Desktop is a free application you can install on your local computer that lets you connect to, transform, and visualize your data. With Power BI Desktop, you can connect to multiple different sources of data, and combine them (often called modeling) into a data model that lets you build visuals, and collections of visuals you can share as reports, with other people inside your organization. Most users who work on Business Intelligence projects use Power BI Desktop to create reports, and then use the Power BI service to share their reports with others.
The most common uses for Power BI Desktop are the following:
- Connect to data
- Transform and clean that data, to create a data model
- Create visuals, such as charts or graphs, that provide visual representations of the data
- Create reports that are collections of visuals, on one or more report pages
- Share reports with others using the Power BI service
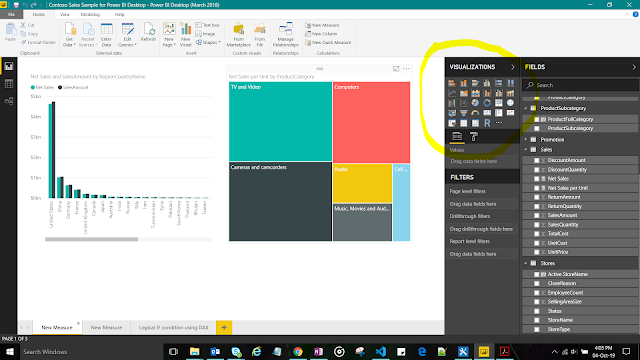
There are three views in Power BI Desktop, shown along the left side of the canvas. The views, shown in the order they appear, are the following:
Report View - this is where you create reports and visuals, and where most of your creation time is spent.
Data View - here you can see the tables, measures, and other data used in the data model associated with your report, and transform the data for best use in the report's model.
Model View - in this view you see and manage the relationships among tables in your data model.

- Transform and clean data, create a model using Query Editor
- Shape and combine data in Power BI Desktop using any sources like Excel, OData, URL
- Combine the data
- Remove unnecessary rows from the data using "Remove Rows" option from top ribbon
- We can create a column in our table and we can do rename, change its data type
- We can merge the two queries with option "Combine" from the top ribbon.
It will asks from table 1 which column and table 2 which column has to lookup each other
- "Visualizations" section can change accordingly as per our requirement to view the data.
- Values and Properties of the fields can able to modify to shape the data.
- We can combine the data with any different data sources. Example: Excel and OData or Excel and SharePoint or OData and Web or Web and Excel with n number of combinations
DAX expression's with IF condition:
https://tejasadventure.blogspot.com/2019/10/power-bi-if-condition.html
DAX expression's with RELATED function:
https://tejasadventure.blogspot.com/2019/10/in-power-bi-what-is-related-function.html
Split Column:
2018-03-30T22:45:00+0000
From top ribbon, click on Split Column and select By Delimiter
For example split "T"
Power BI will split 2018-03 -30 as Date field of its data type and automatically changes in to date format as 30-Aug-2018 and remaining as Time field with "time" or "any" data type format.
Connect "facebook" with Power BI
We can connect via Online Service and connect facebook.
Using Query Editor shape the data eg: use fields like Posts, created date, Number of Comments etc and plot the charts.
The below example show the list of facebook posts and bar chart with number of comments received across each post

Comments
Post a Comment